Export of goods increased at an annualized rate of 22.9% in June-August and since the start of the year industrial exports have grown by about 27%
Data released last week by the Central Bureau of Statistics (CBS) for August show that Israeli exports continue to increase.
CBS's data show that export of goods increased at an annualized rate of 22.9% in June-August and since the start of the year industrial exports have grown by about 27%. Industrial exports totaled $4 billion in August, while imports amounted to $5.7 billion leaving a trade deficit of $1.7 billion.
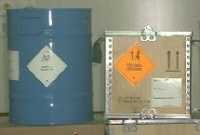
The deficit, excluding diamonds, ships and aircraft, shrank to a seasonally adjusted $1.2 billion, down from $1.25b. in August last year, the Central Bureau of Statistics said Thursday in a preliminary report on its Web site. Chemicals exports rose an annual 83 percent to $1.38b.
Exports by medium-high technology industries (30% of total manufacture exports) in August 2008 totaled $1.1 B. Trend data of exports by medium-high technology industries point to a rise of 33.4%, at an annual rate, in June-August 2008.
Exports by medium-low technology industries (23% of all manufacture exports) in August 2008 totaled $0.8 B. Trend data of exports by medium-low technology industries point to a rise of 15.4%, at an annual rate, in the last three months.
Exports by low technology industries (5% of all manufacture exports) in August 2008 totaled $0.2 B. Trend data of exports by low technology industries point to a rise of 14.5%, at an annual rate, in June-August 2008.
Export of diamonds (polished and rough) in January -August 2008 totaled 7.6 higher by 8.4% than January-August 2007.
Agricultural exports in January -August 2008 totaled $882M (temporary data) – lower by 3.9% than January-August 2007.
Import of goods, in current prices in U.S. dollars, totaled – as mentioned - $5.7 B.
A breakdown of the data of import by use indicates that in August 2008, 36% of total imports were import of raw materials (excluding diamonds and fuels); 13% was machinery, equipment and land vehicles for investment; 13% was consumer goods, and the rest diamonds, fuels and ships and aircraft.
Import of raw materials (excluding diamonds and fuels) in August 2008 totaled $2.1B. A breakdown of trend data reveals that in June-August 2008, import of raw materials rose by annual rate of 14.0%. A breakdown by groups of import of raw materials in the last three months, points to a rise of 47.1% in the import of iron and steel.
Import of investment goods (excluding ships and aircraft) in August 2008 totaled $0.8B. A breakdown of trend data indicates that in June-August 2008, import of investment goods dropped by an annual rate of 10.6%. A breakdown by groups points that import ofmachinery and equipment point to a drop of 1.9% in the last three months.
Import of consumer goods in August 2008 totaled $0.7B. A breakdown of trend data indicates that in the last three months, import of consumer goods dropped by an annual rate of 6.7%. Import of non-durable goods rose by an annual rate of 17.2%. Most of the rise was recorded in import of food and beverages (21.5%). Import of durable goods dropped, by an annual rate of 27.5% during the last three months.
Import of diamonds (rough and polished) in January-August 2008 totaled $6.7B, a rise of 12.3% compared to the same months in 2007.
Import of fuels (crude oil, distillates and coal) in January-August 2008 totaled $9.5B. During the same months in 2007 the import of fuels totaled $5.6 B.
The CBS noted, however, that there was a substantial drop in imports of investment goods and consumer durables. The main optimistic statistic concerning imports related to the import of raw materials, which continued to grow significantly.
CBS: August ‘08 exports up sharply
Export of goods increased at an annualized rate of 22.9% in June-August and since the start of the year industrial exports have grown by about 27%
15.09.08 / 00:00

15.09.08
CBS: August ‘08 exports up sharply
•
More articles that may interest you


More news from Industry & Trade Section
>Jewish High Holidays 2008 – Israeli Customs Authority's announcement/01.09.08
>CBS: Unemployment rate at 20-year low/01.09.08
>Bank of Israel: State of Economy Index drops/25.08.08
>Central Bureau of Statistics: Israel leads OECD in R&D/25.08.08
>Mofaz to vote against budget/25.08.08
>Bar-On unveiled 2009 state budget/18.08.08
>CBS: Israel Trade Deficit Widens In July/18.08.08
>The second Palestinian Industries Exhibition opened in Nablus/18.08.08
>Ministry of Tourism: tourist arrivals in H1 on pace for record year/18.08.08
>Manufacturers warn the possible closure of Israel's textile industry/18.08.08