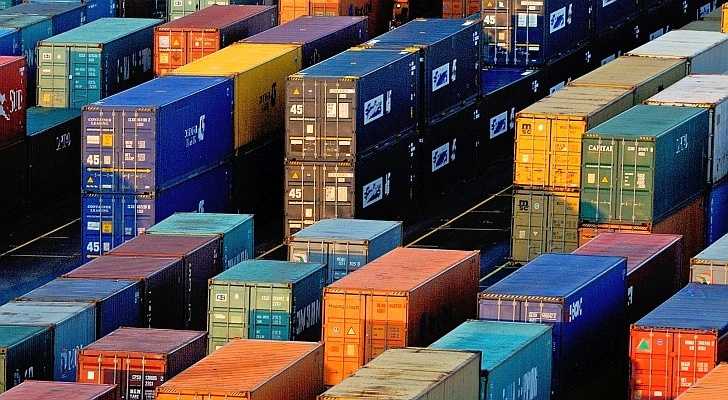
Import of goods for the month totaled NIS19.4 billion, as exports of goods totaled NIS16.6 billion
The Central Bureau of Statistics reported that in November 2012, import of goods totaled NIS 19.4 billion, export of goods totaled NIS 16.6 billion and the trade deficit of goods totaled NIS 2.8 billion.
Export of goods as percent of imports (excluding ships, aircraft and diamonds) constituted in January-November only 70.3%. In January-November 2012 the monthly average trade deficit totaled NIS 6.0 billion that represent an annual deficit of NIS 72.1 billion (NIS 52.2 billion in 2011 and NIS 29.0 billion in 2010).
Export of goods (excluding ships, aircraft and diamonds) rise 5.6% at an annual rate, during September-November 2012 continuing an increase of 9.1% in June-August 2012.
Import of goods, in current prices in New Israel Shekels (NIS), totaled – as mentioned – NIS 19.4 billion.
A breakdown of the data of import by use indicates that in November 2012, 40% of total imports were import of raw materials (excluding diamonds and fuels); 15% were consumer goods; 13% were machinery, equipment and land vehicles for investment; and the rest diamonds, fuels, ships and aircraft.
Trend data of imported raw materials (excluding diamonds and fuels) fall 13.7%, in September-November 2012, at an annual rate after an increase of 6.9% in June-August 2012. A breakdown by groups of import of raw materials, in the last three months, shows that imports of inputs of chemicals fall 16.6% in an annual rate and import of iron and steel fall 18.0% in an annual rate.
Trend data of import of consumer goods fall 4.9%, in the last three months, at an annual rate, continuing a decrease of 0.5% in June-August 2012. Import of non-durable goods fall, by an annual rate of 3.5%, during the last three months.
Most of the decrease was recorded in import of medicines category (22.6% at
an annual rate). Import of durable goods, fall in the same period 7.7% by an annual rate. Most of the fall was recorded in import of furniture and electrical equipment.
Trend data of Import of investment goods (excluding ships and aircraft) fall 14.7%, by an annual rate, in September-November 2012 continuing a decrease of 11.1% in June-August. A breakdown by groups points that import of machinery and equipment (74% of investment imports) fall 20.8% in the last three months. Imports of vehicles for investment rose 13.1%, at an annual rate, during the same period.
Import of diamonds (rough and polished) in January-November 2012 totaled NIS 27.1 billion. During the same months in 2011 the import of diamonds totaled NIS32.6 billion.
Import of fuels (crude oil, distillates and coal) in January-November 2012 totaled NIS 57.5 billion a rise of 28.7% compared to the same months of the previous year.
Export of goods, in current prices in New Israel Shekels (NIS), totaled in November 2012– as mentioned – NIS 16.6 billion.
In November 2012, manufacturing exports (excluding diamonds) constituted 80% of all export of goods. Export of diamonds constituted 17%, and the remaining 3% was agricultural exports.
Trend data of manufacturing exports rose 5.1%, at an annual rate, in September-November 2012, continuing an increase of 8.0% in June-August 2012.
Trend data of exports by high technology industries (47% of total manufacture exports) rose 36.1%, at an annual rate, in September-November 2012 continuing an increase of 39.3% in June-August 2012. Breakdown by economic activity shows that exports of pharmaceutical products rose 69.9%.
Trend data of exports by medium-high technology industries (32% of total manufacture exports) rose 10.3%, at an annual rate, in September-November 2012 continuing an increase of 5.8% during June-August. Breakdown by economic activity shows that exports of machinery and equipment rose 10.8%.
Trend data of exports by medium-low technology industries (16% of total manufacture exports) fall 27.4%, at an annual rate, in the last three months following a decrease of 17.6% in June-August 2012. Breakdown by economic activity shows that exports of basic metal products fall 14.5%.
Trend data of exports by low technology industries (5% of total manufacture exports) fall 14.3% at an annual rate, in September-November 2012 continuing a decrease of 14.3% in June-August 2012. Breakdown by economic activity shows that exports of textiles, wearing apparel and leather fall 15.9% in the same period.
Export of diamonds (net, polished and rough), in January-November 2012, totaled NIS 30.9B (NIS 37.6 billiob in January -November 2011).
Agricultural exports in January -November 2012 totaled NIS 4.7 billion (temporary data), a rise of 6.0% compared to the same period in 2011. Export of citrus fruit rose 38.0% and export of cotton and other field crops rose 43.8%. Exports of flowers fall 7.8% during the same period.
November 2012 trade deficit NIS 2.8 billion
Import of goods for the month totaled NIS19.4 billion, as exports of goods totaled NIS16.6 billion
18.12.12 / 00:00
18.12.12
November 2012 trade deficit NIS 2.8 billion
•
More articles that may interest you

CCNI carried 70 tons Israeli made desalination plant to Chile

Zim urges Israeli Government to split the company into foreign and domestic entities
The Bank of Israel keeps the interest rate forDecember 2012 unchanged at 2%

38 ships worked in Ashdod during rocket attacks

Israel's service exports up 7% during the first nine months of 2012

El Al announced taking aging Boeing 757s out of service
More news from Industry & Trade Section
>IEEE Standards Association partners with Israel's Standards Institute/28.11.12
>Imports of goods to Israel in October totaled NIS23/7 billion/28.11.12
>Israel's third quarter GDP slows/28.11.12
>October CPI down 0.2%/21.11.12
>Israel, Slovakia signed joint statement on industrial R&D/21.11.12
>Israel's October PMI down 0.4 point to 37.6 pts/21.11.12
>Israel and Panama signed double taxation treaty/21.11.12
>Egypt reaffirmed amendment to the qualifying industrial zone (QIZ) agreement/12.11.12
>Israel’s unemployment 6.8% in September/12.11.12
>Israel ranks 40th out of 142 countries polled by the 2012 Legatum Prosperity Index/12.11.12